Advertising is a subjective discipline. Facebook managed to make it more or less exact with its metrics. Thanks to Ads Manager, we can create campaigns tailored to our needs. More importantly, in accordance with the goals, we can follow the results of our ads.
Facebook provided us the possibility to reach a large number of people for less money in comparison to traditional advertising. To reach the ones interested in our brand. We will try to explain each of them in order to understand and take what Facebook offers us.
Let’s start with an abbreviation familiar to us from the traditional marketing – KPI. According to the KPI, we will define the goal of our campaign, and the type it belongs to. Is it an Awareness campaign that aims to reach a large number of people; a Consideration campaign that enables interaction with its users, or a Conversion campaign that aims to enhance sales?
The metrics we are interested in will depend on the campaign type. We will try to clarify the most common ones in this text.
Reach
It refers to the unique number of users our post reached to. There are two types, organic and paid reach, though the organic reach is quite rare, it almost doesn’t exist. Reach reveals a lot about the success of our posts, but we can get the complete picture only in combination with other metrics.
It is important to distinguish between reach and Impressions. Reach represents the number of users that saw a post, while impressions represent the total number of post views. According to a rule, impressions should be presented by a bigger number because one user can see a post more than once.
Engagement
This is probably the most popular word in digital marketing. Engagement tells us about the reactions of our audience to our content. It shows the total number of likes, shares, comments, clicks…
We can have full information when we divide total engagement with reach and multiply that number by 100%. Then we get the engagement rate – the number that directly tells us how interesting our post was to our audience.
If our reach is 1 000, engagement 300, it means our post is more interesting to our audience than when we have identical engagement on the post that reached 10 000 unique users.
Based on this year’s data, the average engagement rate on brand pages is 0.27%.
Audience retention
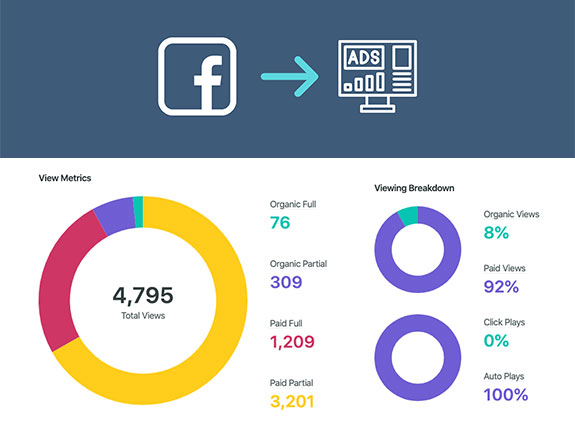
This metric relates only to video content published on our page, and it shows how much time someone spent watching our video. This information is helpful as we can adjust the duration, or change the schedule of the content so we can make sure the information we want to present will reach our audience. A term view relates to each video view that lasted at least three seconds, and this counts as one view.
The “C” abbreviations
These abbreviations tell us about the amount of money we spend and where that money goes.
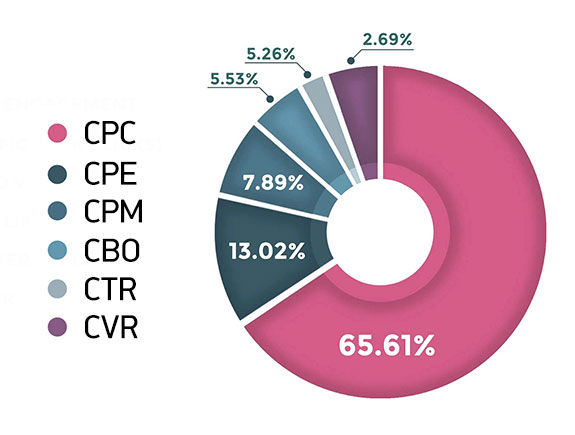
CPC or Cost per Click presents the cost of click and it is one of the most used metrics for determining the success of the campaign. The lower the cost, the better result that shows our creative was successful and the target audience well-selected.
Besides the clicks, we can see the cost of individual interaction CPE (Cost per Engagement).
CPM (Cost per Mile) presents the cost at each 1 000 impressions. If the goal of our campaign is brand awareness, this metric is most commonly used.
CBO (Campaign Budget Optimization) presents the optimization of the campaign budget. If we choose this option, Facebook will allocate our funds to different groups of ads with an aim to bring us optimal results.
CTR (Click Through Rate) is a percentage of people who have seen our ad and clicked on it. It is calculated when the total number of clicks is divided by the number of impressions. In some situations, when the traffic to our website is not a priority goal of the campaign, the CTR metric doesn’t matter too much.
CVR (Conversion Rate) is the number that probably interests us the most as it presents the number of conversions, i.e., the percentage of people who made a purchase after clicking the ad.
Follower demographics
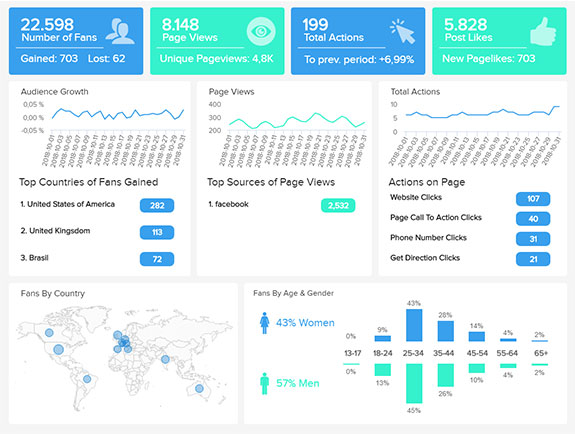
This metric shows our overall performance on the networks. It shows the people who follow us, divided into different groups, based on age, gender, location…Thanks to this metric, we can tailor the content according to our audience’s tastes. Or we can make changes if people who started following us don’t match with the apriori-defined audience.
Facebook offers many other metrics but our goal was to list the basic and most important ones that could help us understand better the principle of online advertising, our target group, as well as the way and content type we can achieve the goal with.


